安装
yarn add @antv/g6
npm install --save @antv/g6
示例
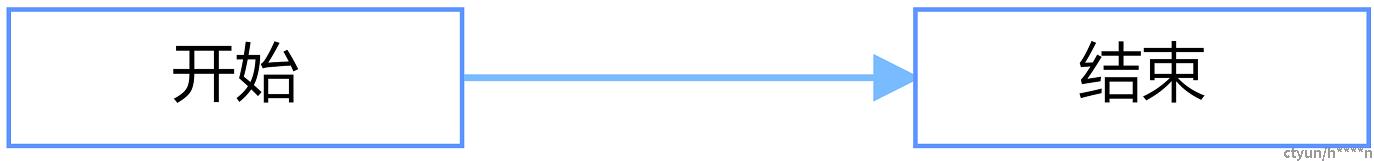
1. 使用derage布局绘制流程图
<div id="flowChartContainer"><div>
import G6 from '@antv/g6'
 const data= {
      // 节点
      nodes: [
        {
          id: "node1", // 节点的唯一标识
          type: 'rect', //节点形状,矩形
          label: "开始", // 文本
        },
        {
          id: "node2",
          type: 'rect', //节点形状,矩形
          label: "结束",
        },
      ],
      // 边
      edges: [
        {
          source: "node1", // 起始节点id
          target: "node2", // 目标节点id
        },
      ],
    };
const container = document.getElementById('flowChartContainer') //获取流程图容器
const graph = new G6.Graph({
  container: 'container',
  width:window.innerWidth,//定义流程图的宽度
  height:1000px,//定义流程图的宽度
  layout: {
    type: 'dagre', //darge布局
    rankdir:'lr',// 'TB' / 'BT' / 'LR' / 'RL' layout 的方向。T:top;B:bottom;L:left;R:right
    nodesepFunc: (d) => { //节点水平间距(px)的回调函数,通过该参数可以对不同节点设置不同的节点间距。
      if (d.id === '3') {
        return 500;
      }
      return 50;
    },
    ranksep: 70, // 层间距(px)的回调函数,通过该参数可以对不同节点设置不同的层间距。
    controlPoints: true,//是否保留布局连线的控制点
  },
  defaultNode: {
    type: 'rect',
  },
  defaultEdge: {
    type: 'polyline', //折线
    style: {
      radius: 20,
      offset: 45,
      endArrow: true,
      lineWidth: 2,
      stroke: '#C2C8D5',
    },
  },
  nodeStateStyles: {
    selected: {
      stroke: '#d9d9d9',
      fill: '#5394ef',
    },
  },
  modes: {
    default: [
      'drag-canvas', //拖拽
      'zoom-canvas', //缩放
      'click-select', //节点选择
      {// tooltip提示
        type: 'tooltip',
        formatText(model) {
          return '这是一个tooltip';
        },
        offset: 30,
      },
    ],
  },
  fitView: true,//适应画布
})
graph.data(data)
graph.render()
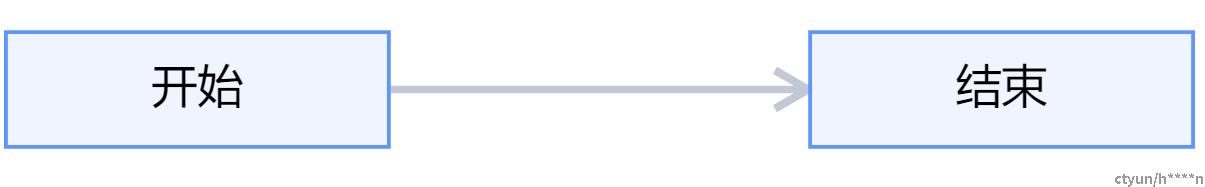
2. 使用自定义布局绘制流程图
const data= {
      // 节点
      nodes: [
        {
          id: "node1", // 节点的唯一标识
          type: 'rect', //节点形状,矩形
          label: "开始", // 文本
          x:100,
          y:200,
          anchorPoints: [ // 定义连接点
            [0.5, 0],
            [1, 0.5],
            [0.5, 1],
            [0, 0.5],
          ],
        },
        {
          id: "node2",
          type: 'rect', //节点形状,矩形
          label: "结束",
          x:300,
          y:200,
          anchorPoints: [
            [0.5, 0],
            [1, 0.5],
            [0.5, 1],
            [0, 0.5],
          ],
        },
      ],
      // 边
      edges: [
        {
          source: "node1", // 起始节点id
          target: "node2", // 目标节点id
          sourceAnchor: 1, //源连接点
          targetAnchor: 3,//目标连接点
        },
      ],
    }
const width = container.scrollWidth;
const height = container.scrollHeight || 500;
const graph = new G6.Graph({
  container: 'flowChartContainer',
  width:width,
  height: height,
  pixelRatio: 2,
  fitView: true,
  defaultNode: {
    type: 'rect',
    style: {
      lineWidth: 1,
      fill: '#fff',
    },
    labelCfg: {
      style: {
        fontSize: 14, // 设置字体大小
      },
    },
  },
  groupByTypes: false,
  defaultEdge: {
    size: 1.5,
    type: 'polyline',
    color:'#79bbff',
    style: {
      endArrow: {
        path: 'M 0,0 L 8,4 L 8,-4 Z',
        fill:'#79bbff',
      },
    },
  },
});
graph.data(data)
graph.render()