


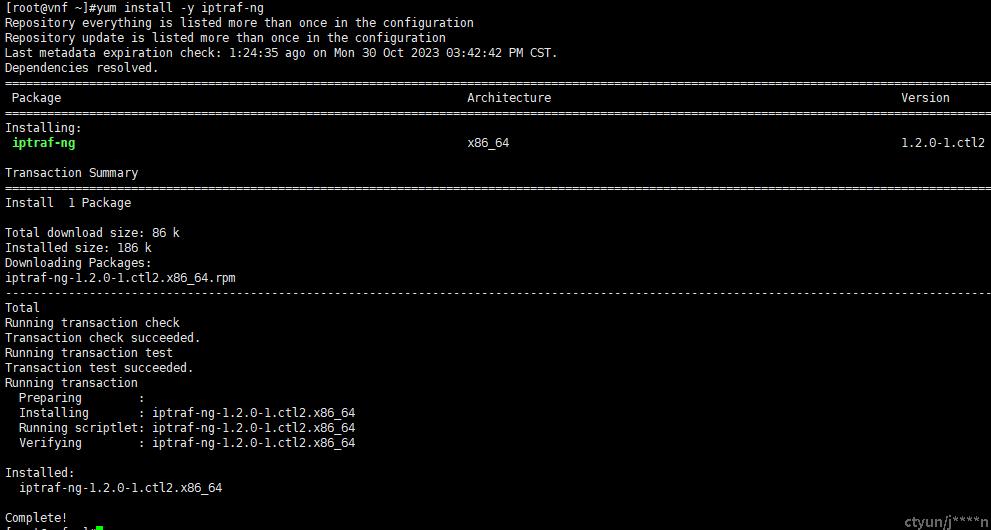
工具安装:
yum install -y iptraf-ng
使用说明:
usage: iptraf-ng [options]
or: iptraf-ng [options] -B [-i <iface> | -d <iface> | -s <iface> | -z <iface> | -l <iface> | -g]
-h, --help show this help message
-i <iface> start the IP traffic monitor (use '-i all' for all interfaces)
-d <iface> start the detailed statistics facility on an interface
-s <iface> start the TCP and UDP monitor on an interface
-z <iface> shows the packet size counts on an interface
-l <iface> start the LAN station monitor (use '-l all' for all LAN interfaces)
-g start the general interface statistics
-B run in background (use only with one of the above parameters
-f clear all locks and counters
-t <n> run only for the specified <n> number of minutes
-L <logfile> specifies an alternate log file
使用演示:
iptraf-ng -g
查看该机器上接口粒度的流量汇总

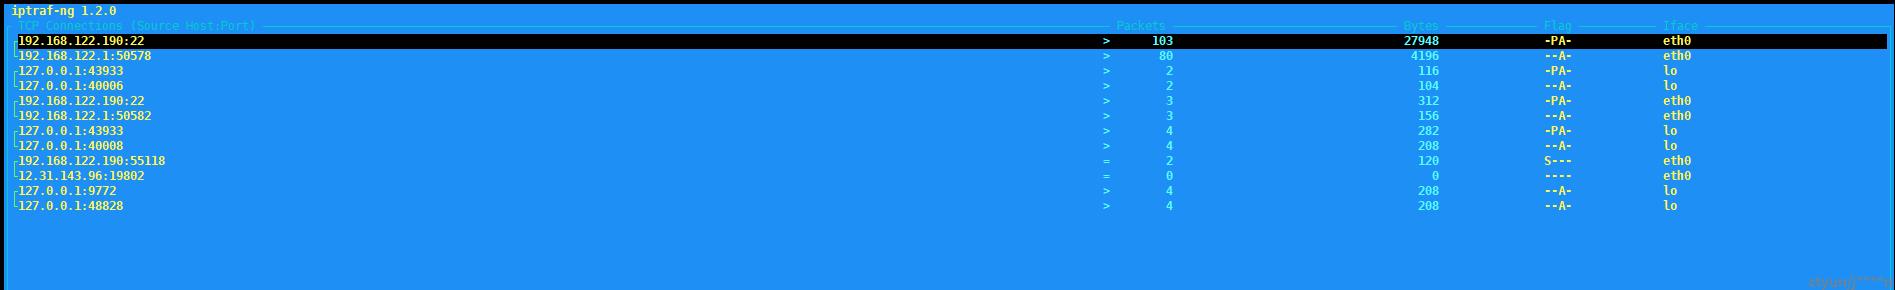
iptraf-ng -i all
完成所有接口的IP粒度的流量汇总
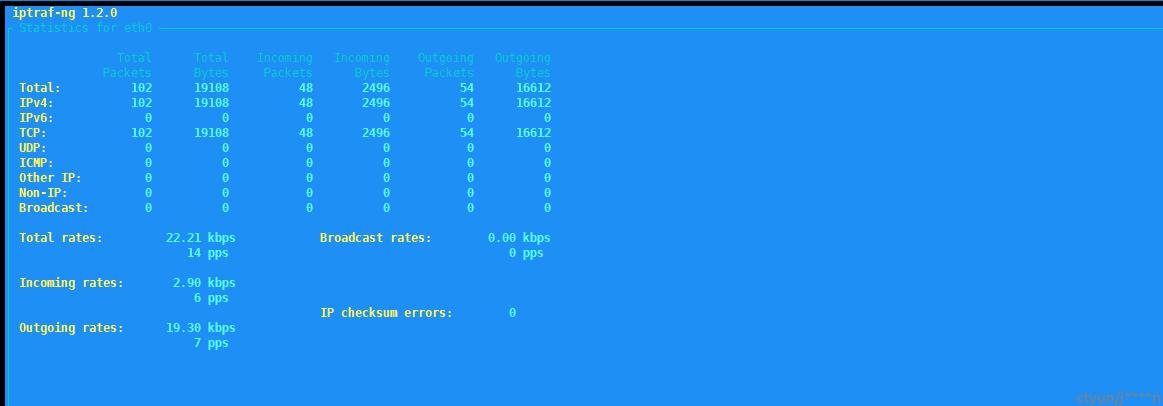
iptraf-ng -i eth0
根据协议类型,入出方向完成指定接口的流量汇总
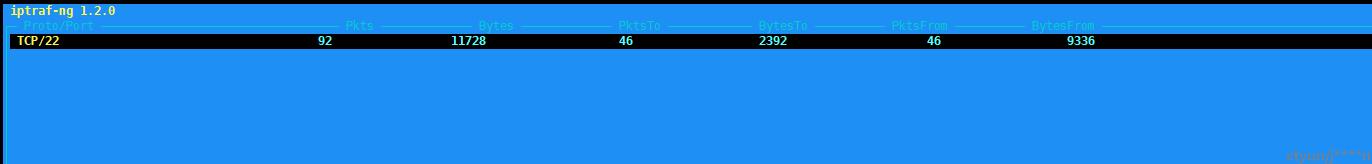
iptraf-ng -s eth0
完成指定接口的协议/目的端口粒度的流量汇总
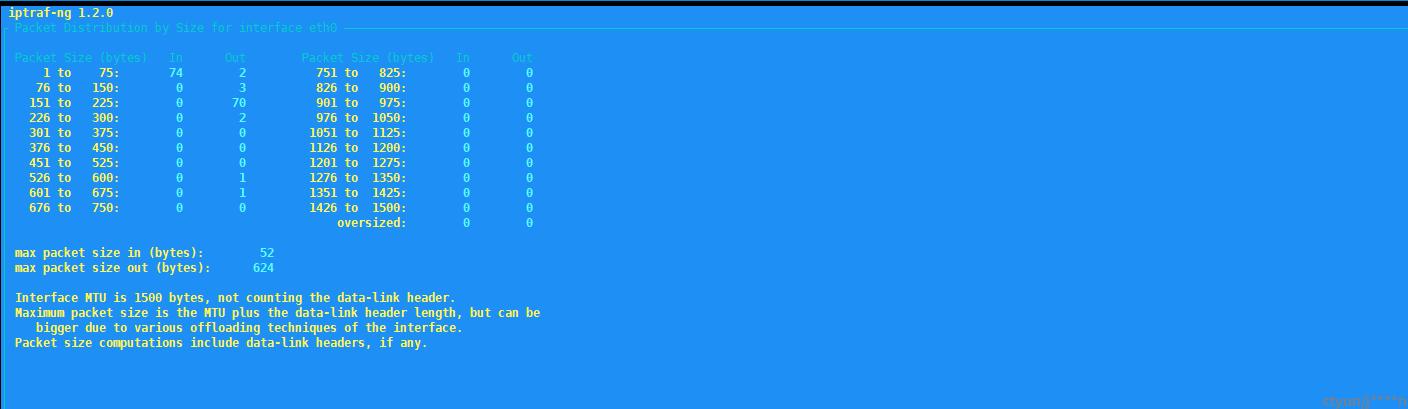
iptraf-ng -z eth0
完成指定接口收发报文长度的流量汇总
iptraf-ng -l eth0
完成指定接口收发mac的流量汇总

