


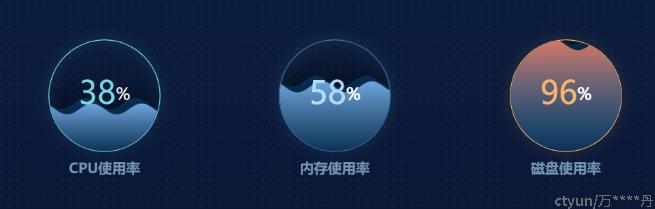
水球图是Echarts中的一个插件,可以用来动态美观地展示单个百分比数据。
在使用水球图之前,需要安装和引入echarts和echarts-liquidfill,然后配置各种属性来实现不同的水流效果。
安装
使用npm安装echarts和echarts-liquidfill。
npm install echarts --save
npm install echarts-liquidfill --save注意版本的匹配!echarts@5匹配echarts-liquidfill@3,echarts@4匹配echarts-liquidfill@2。
全局引入
import echarts from 'echarts' // 引入echarts4.0
import * as echarts from 'echarts' // 引入echarts5.0
import 'echarts-liquidfill'
Vue.prototype.$echarts = echarts注意引入echarts@4和echarts@5的区别!
配置
const option = {
  title: {
    text: 'CPU使用率', // 水球图标题
    // 标题样式
    textStyle: {
       fontSize: 16,
       fontFamily: 'PingFangSC-Regular',
       color: '#7398B3FF'
    }
  },
  series: [{
      type: 'liquidFill', // 和其他echarts图一样,需要配置type属性,水球图为liquidFill
      radius: '50%', // 水球图的半径
      center: ['50%', '50%'], // 水球图在整个画布的位置
      shape: 'circle', // 波浪的形状,可选值有circle, rect, roundRect, triangle, diamond, pin, arrow或者svg路径
      direction: 'left', // 水流的方向
      animationEasing: 'linear', // 初始动画函数
      animationEasingUpdate: 'linear', // 数据更新时的动画函数
      waveAnimation: true, // 为false时不流动,可以实现静止的波浪效果
      animationDuration: 0, // 初始动画持续的时长
      animationDurationUpdate: 0, // 控制更新动画持续的时长
      data: [this.chartData.data[type] + 0.05, this.chartData.data[type]], // 波浪的高度占比,可以设置多个数值以实现多个波浪效果
      waveLength: '45%', // 波的长度,值越大波浪起伏越小
      amplitude: '5%', // 振幅,为0可以实现平静的水面效果
      phase: 0, // 波的相位弧度
      period: 1000, // 向前移动一个波长所需要的毫秒数
      backgroundStyle: {
        color: 'transparent'
      },
      // 波浪的颜色
      color: ['#0B355B', new _this.$echarts.graphic.LinearGradient(0, 0, 0, 1, [{
        offset: 0,
        color: this.chartData.liquidColor[rank][0]
      }, {
        offset: 1,
        color: this.chartData.liquidColor[rank][1]
      }], false)],
      // 水球图的外层边框
      outline: {
        show: true,
        borderDistance: 0,
        itemStyle: {
          color: 'transparent',
          borderColor: this.chartData.borderColor[rank],
          borderWidth: 1,
          shadowBlur: 13,
          shadowColor: this.chartData.shadowColor[rank]
        }
      },
      // 水球图里面的文字和字体样式设置
      label: {
        normal: {
          color: this.chartData.labelColor[rank],
          insideColor: this.chartData.labelColor[rank],
          formatter: function () {
            return (_this.chartData.data[type] * 100).toFixed(0) + '{a|%}'
          },
          textStyle: {
            fontSize: 36,
            fontFamily: 'PingFangSC-Medium',
            fontWeight: 500,
            rich: {
              a: {
                fontSize: 18,
                color: '#fff',
                fontFamily: 'PingFangSC-Medium',
                fontWeight: 500
              }
            }
          }
        }
      }
    }]
}
