ftrace作为常用的内核追踪工具,可以跟踪内核函数/调用栈及指定event等,不过使用ftrace需要一系列的配置,通过读入读出文件来使能对应函数event及查看输出,使用起来比较繁琐。本文介绍一个ftrace的前端工具-trace-cmd,可以替代ftrace完成相应功能。
一 trace-cmd 安装
trace-cmd作为ftrace的命令行工具,需要依赖tracefs,可以下面方式验证tracefs是否已经挂载。一般系统已经默认加载,没有的话可以通过mount命令挂载

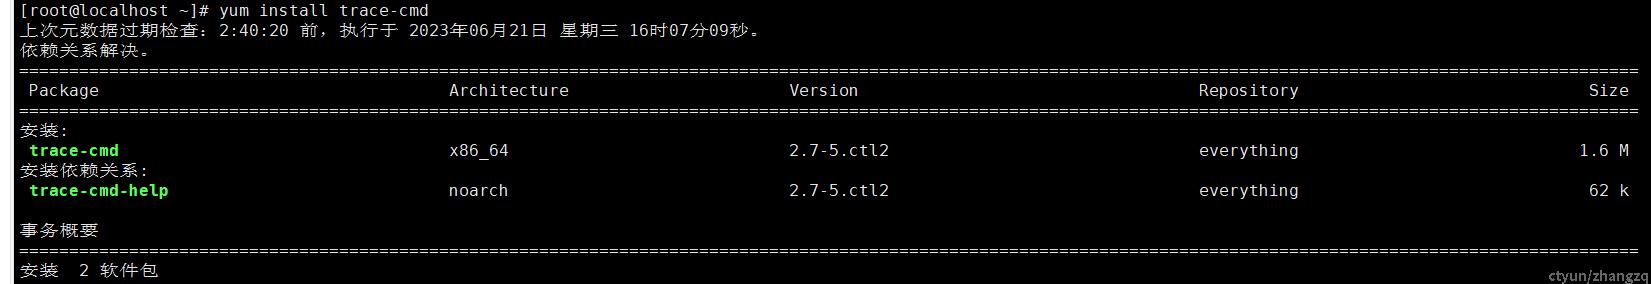
对于ctenos以及ctyunos系列操作系统,可以通过yum进行安装。
二 tracd-cmd使用
[root@localhost ~]# trace-cmd --help

trace-cmd version 2.7.

usage:
  trace-cmd [COMMAND] ...

  commands:
     record - record a trace into a trace.dat file
     start - start tracing without recording into a file
     extract - extract a trace from the kernel
     stop - stop the kernel from recording trace data
     restart - restart the kernel trace data recording
     show - show the contents of the kernel tracing buffer
     reset - disable all kernel tracing and clear the trace buffers
     clear - clear the trace buffers
     report - read out the trace stored in a trace.dat file
     stream - Start tracing and read the output directly
     profile - Start profiling and read the output directly
     hist - show a historgram of the trace.dat information
     stat - show the status of the running tracing (ftrace) system
     split - parse a trace.dat file into smaller file(s)
     options - list the plugin options available for trace-cmd report
     listen - listen on a network socket for trace clients
     list - list the available events, plugins or options
     restore - restore a crashed record
     snapshot - take snapshot of running trace
     stack - output, enable or disable kernel stack tracing
     check-events - parse trace event formats
首先我们可以通过--help参数,查看主要有哪些命令及含义。另外,针对每个comand,同样可以通过--help查看具体的使用,如我们可以看下trace-cmd list的具体使用。
[root@localhost ~]# trace-cmd list -h

trace-cmd version 2.7.

usage:
 trace-cmd list [-e [regex]][-t][-o][-f [regex]]
          -e list available events
            -F show event format
            -R show event triggers
            -l show event filters
          -t list available tracers
          -o list available options
          -f [regex] list available functions to filter on
          -P list loaded plugin files (by path)
          -O list plugin options
          -B list defined buffer instances
          -C list the defined clocks (and active one)
默认使用trace-cmd list不带具体参数,会打印很多信息,不便过滤,我们可以通过具体的参数过滤我们想要的信息。
2.1 list 可用的追踪器。
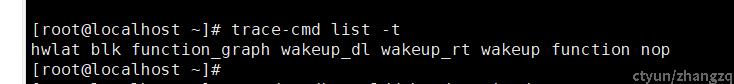
trace-cdm list -t 列出可用的追踪器,对应于直接使用ftrace时,必须通过查看文件的内容的方式了解有哪些追踪器可用(如下),明显通过trace-cmd工具会更方便。

2.2 启动追踪器
正常使用中我们经常使用到,function和functiong_graph两个,以function_grap为例启动一个追踪器。
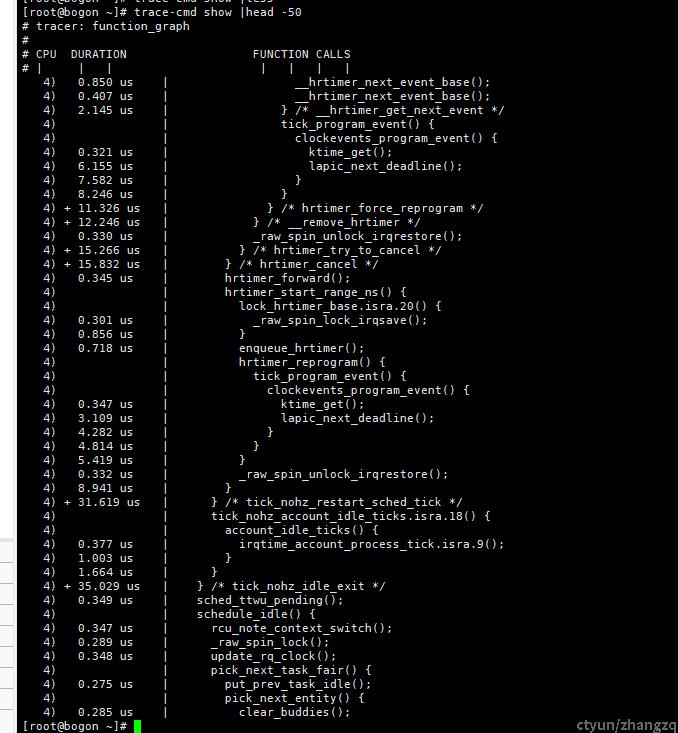
通过trace-cmd show可以显示当前缓冲区中内容,如上所示,可以看到完整的调用栈信息,及对应函数耗时等信息,方便问题定位分析。
2.3 停止追踪并清除缓冲区
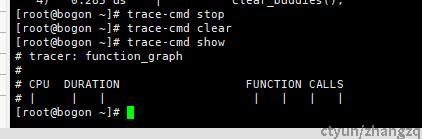
可通过stop停止追踪,并通过clear清除缓冲区。
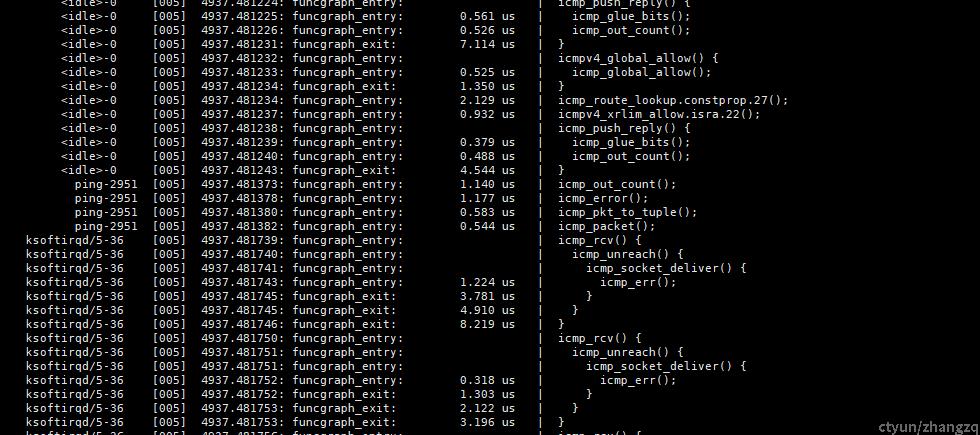
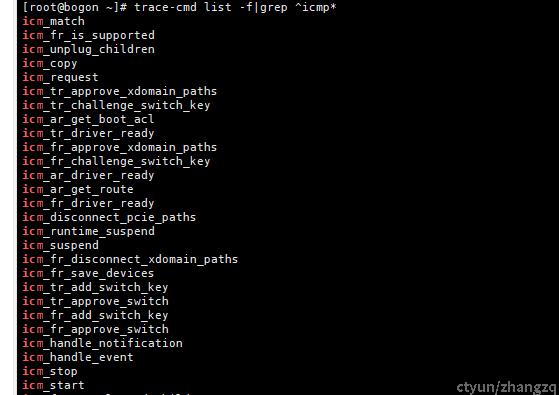
2.4 通过record根据特定函数的调用栈信息
我们常需要跟踪特性函数相关的调用栈信息如跟踪icmp协议流程,可以先通过list 命令查看icmp有哪些相关函数。
然后,通过record命令后面加上你想要追踪的函数模式,及想用到的追踪器,如通过function_graph追踪器跟踪icmp相关调用栈信息。具体参数使用可以通过--help查看
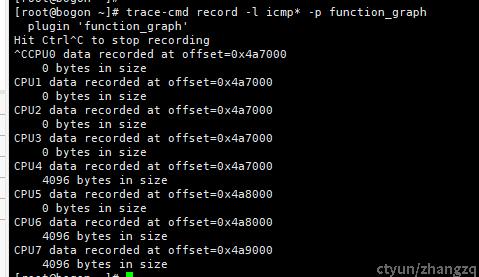
然后可以通过report命令查看追踪结果。